
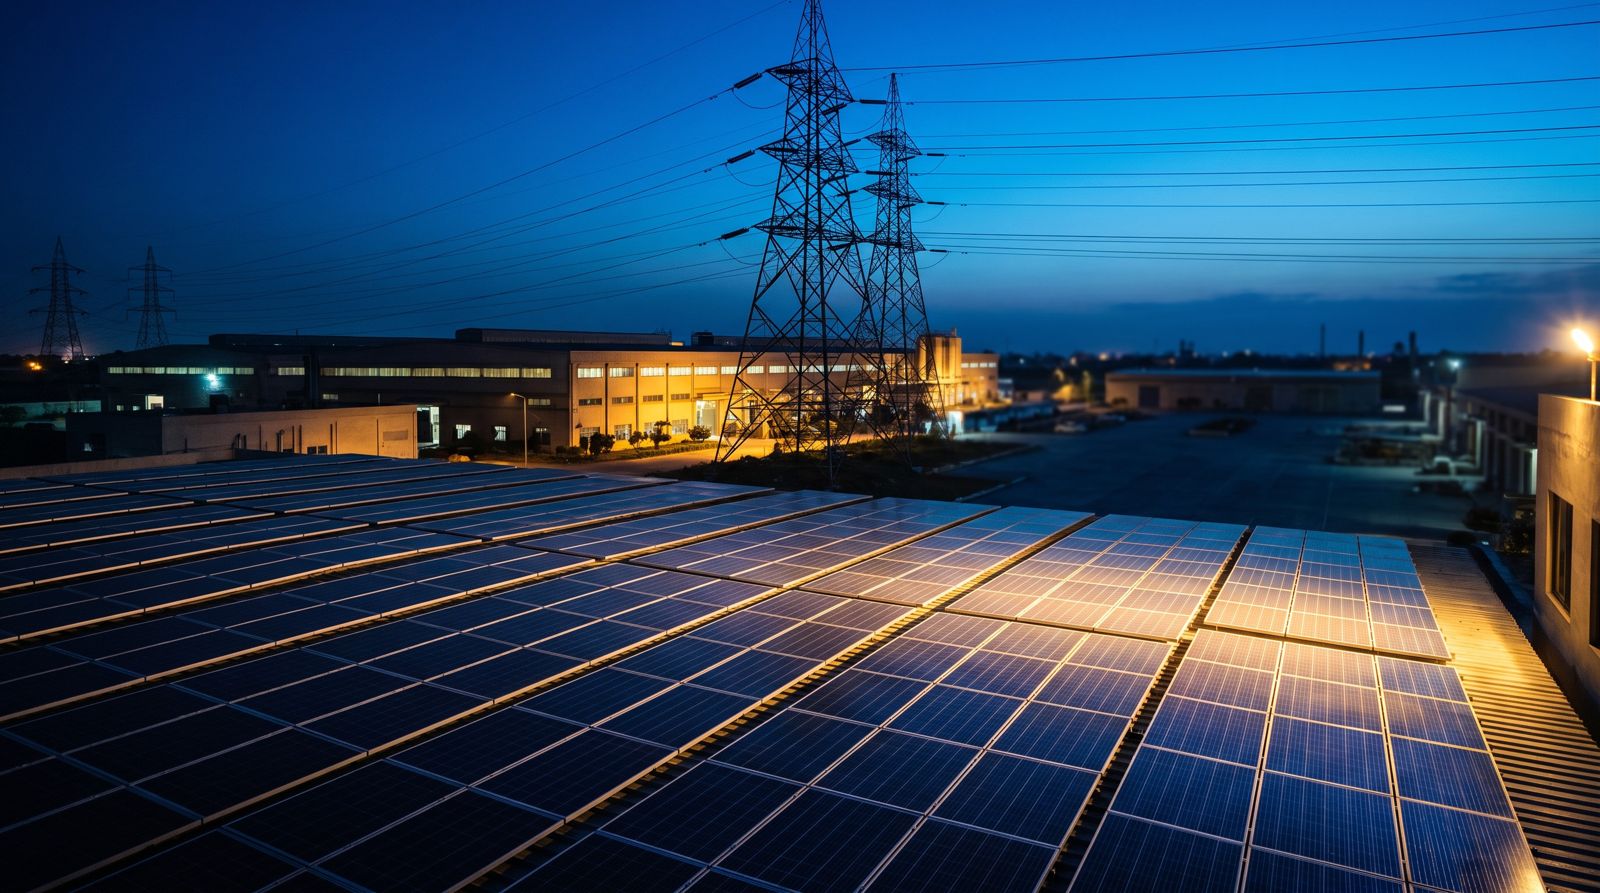
Industry 4.0 starts with value, not technology
Many smart-factory projects stall after the pilot because nobody can show what they earned. Energy is different: every improvement shows up in rupees on next month's bill. That makes it the best first step of your Industry 4.0 journey.
Three rules for Industrial IoT that pays
What works in digitalisation projects, and how we apply it to energy.
Design the value first
Every use case starts with a figure you can check: the demand charge, the PF penalty, the solar yield, genset fuel. Technology comes second.
Let the shop floor choose
The engineers and operators who run the plant know where the losses are. They pick the meters, limits and alerts, and see the result themselves.
Build on what you have
Real plants are brownfield: many meter brands, old panels, mixed gensets. Zainergy EMS reads them as they are and scales from one panel to every site.
The Industry 4.0 stack, for energy
Five layers, from the meter in your panel to a decision on your phone. We supply and run all of them, so your team works with results, not with technology.
From pilot to measured value
Why energy monitoring escapes the pilot stage where many IIoT projects stop.
| A typical IIoT pilot | Zainergy EMS | |
|---|---|---|
| Starting point | A technology to try out | A cost on your bill to bring down |
| Hardware | New sensors and a new network | The meters already in your panels, plus a small gateway |
| First data | After weeks of integration | The day the gateway is fitted |
| Value | Hard to put a number on | Demand charge, PF penalty and solar yield, in rupees |
| Rollout | Each site is a new project | The same gateway and app at every site, one login for all |
| Who uses it | The project team | Plant managers, engineers, finance and site staff, each with their own view |
Industry 4.0 technologies inside Zainergy EMS
Industrial IoT
Gateways on RS485 Modbus with automatic device discovery and per-device intervals.
Cloud computing
Readings stored securely in the cloud, available from any browser or phone, 24/7.
AI and analytics
AI-written reports on demand, power factor and power quality, and a voice assistant.
A live digital view
Your single-line diagram and your building in 3D, coloured by live load.
Remote management
Gateway settings changed and firmware updated over the air, with automatic fallback.
Real-time alerts
Limits on any reading, checked every minute, shown on web and mobile.
Open data
A table and CSV download under every chart, for Excel or your own systems.
Sustainability
Carbon footprint and CO₂ avoided by solar, for ESG and export buyers.
Power factor per billing month (0.80 to 1.00), penalty below 0.90
Stage plan
4×5, 4×10, 2×15, 2×20, 4×30 kvar, 7% detuned
Energy use cases ranked by value
Where Pakistani plants usually find money first.
- Maximum demand: one 30-minute peak sets the month's demand charge
- Power factor: a failing capacitor bank brings the penalty back
- Solar yield: dust and tripped inverters cut generation quietly
- Genset hours: every genset unit usually costs more than a grid unit
- Power quality: harmonics shorten the life of cables, motors and capacitors
- Cost allocation: each department sees and owns its share